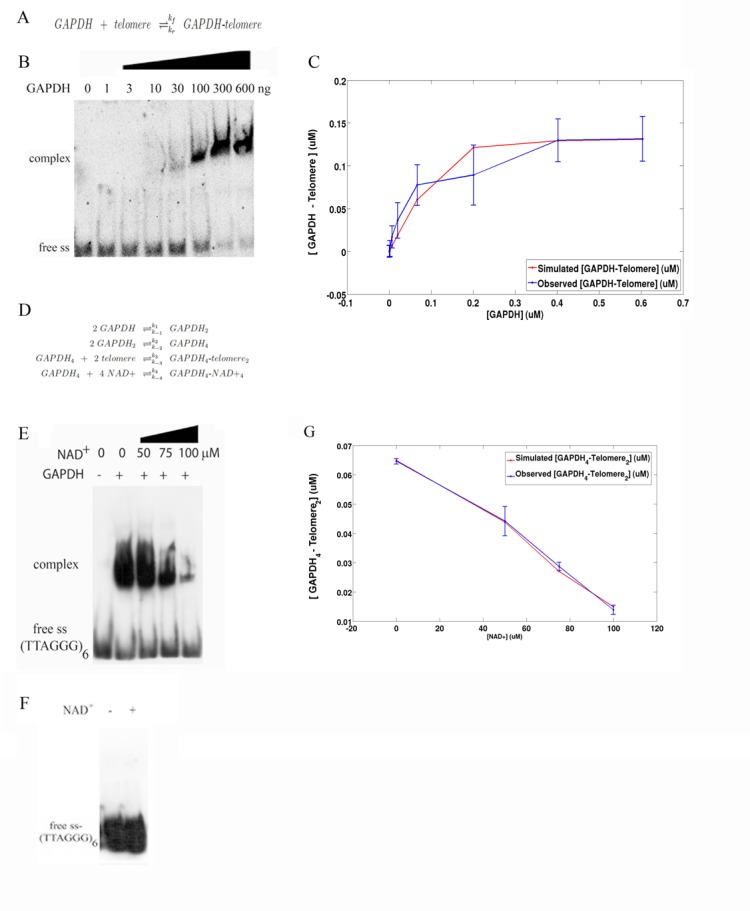
Fig 2. Mathematical model reproduces the association between GAPDH and telomere.

(A) Chemical reaction that describes the dynamic equilibrium between the amounts of GAPDH, telomere and GAPDH-telomere complex. (B) 0.155μM of ss-(TTAGGG)6 labeled oligo were incubated with crescent amount of GAPDH. Samples were analyzed by EMSA. (C) Graph that describes the fraction of telomere bound to GAPDH as a function of the concentration levels of GAPDH. Each point of the blue line represents the quantification average of five independent biological experiments (presented on B). The red line is the result of a computational simulation that was obtained using a curve-fitting optimization on the system of differential equations presented in S1 Fig. (D) Chemical reactions that, coupled with the reaction depicted in A, describe the competition between NAD+ and telomeres for binding with GAPDH. (E) Labeled ss (TTAGGG)6 was incubated with 1.35 μM recombinant T. cruzi GAPDH in the presence of increasing concentrations of NAD+. The samples were analyzed by EMSA. (F) Labeled ss (TTAGGG)6 oligos were incubated in the presence (+) or absence (-) of 50 μM NAD+. The samples were subsequently analyzed by EMSA. (G) Graph that describes the fraction of 2 telomeres bound to tetramer GAPDH as a function of the concentration levels of NAD+. Each point of the blue line represents the quantification average of five independent biological experiments presented in E. The red line is the result of a computational simulation that was obtained using a curve-fitting optimization on the system of differential equations presented in S2 Fig.
