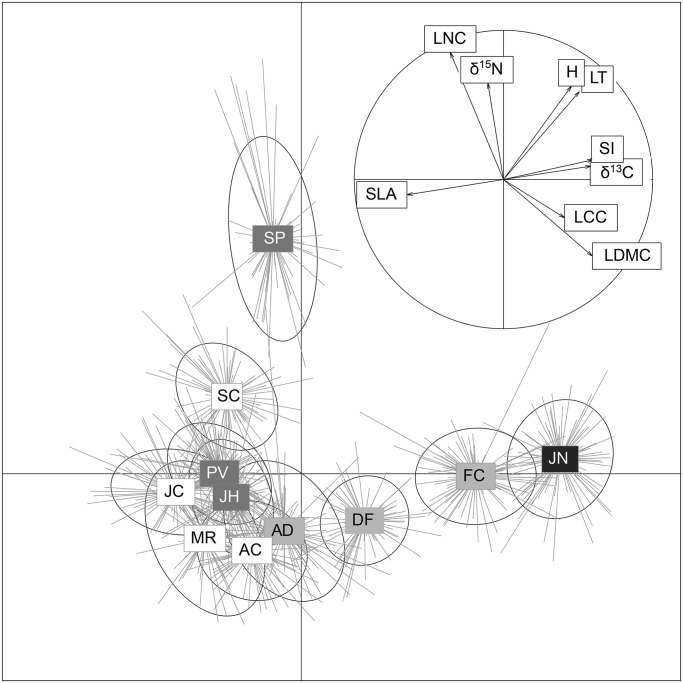
Fig 1. Principal component analysis (PCAs) using the nine traits measured in eleven species for a total of 856 individuals.
The variability of individuals of each species and their distributions along trait axes is represented in the main PCA by lines that arise from species mean value and by an ellipse of dispersion. The minor PCA shows the correlation between the nine traits using all data. Species names are included by using acronyms and colour-coded by their growth form: (i) Hemicryptophyte (dark grey): PV (Pilosella vahlii), SP (Senecio carpetanus), JH (Jurinea humilis); (ii) cushion chamaephyte (white): AC (Armeria caespitosa), JC (Jasione crispa), MR (Minuartia recurva), SC (Silene ciliata); (iii) caespitosous hemicryptophyte (light grey) FC (Festuca curvifolia), DF (Deschampsia flexuosa), AD (Agrostis delicatula); (iv) shrub (black) JN (Juniperus communis subsp. alpina). Acronyms for traits: plant size (IS), plant height (H), leaf thickness (LT), specific leaf area (SLA), leaf dry matter content (LDMC), leaf carbon content (LCC), leaf nitrogen content (LNC), carbon and nitrogen isotopes ratios (δ13C and δ15N, respectively).

