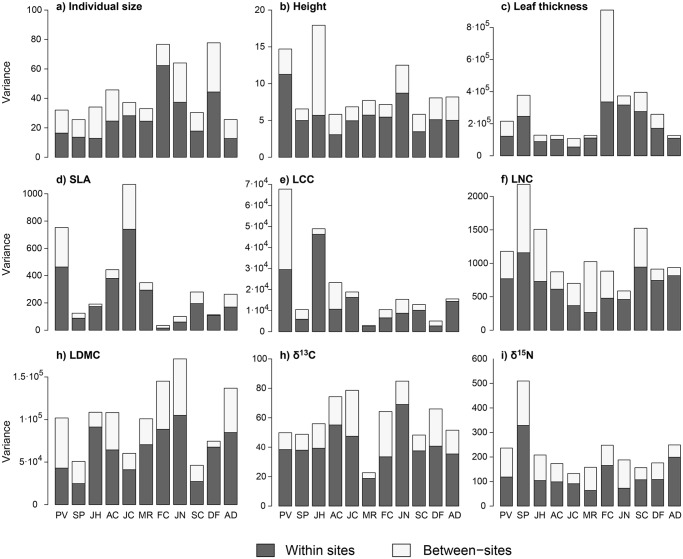
Fig 2. Partition of variance between and within sites for each species and trait (a-i).
Decomposition of variance into two levels, within and between sites (grey and white bars respectively), obtained from an analysis of variance model for each of the eleven species and nine traits. Species and trait labels are the same as in Fig. 1.

