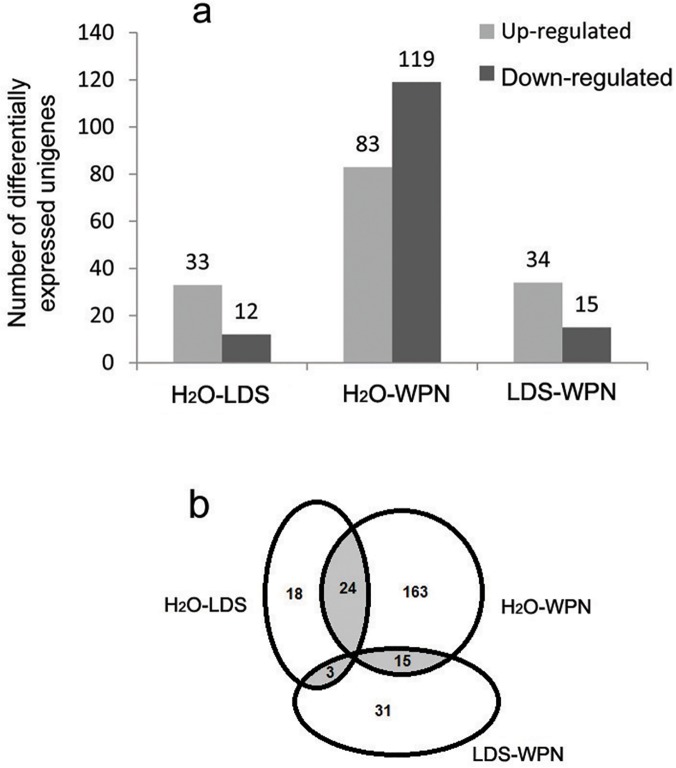
Fig 3. Overview of the distribution of differentially expressed unigenes.
a: Comparison of up- and down-regulated unigenes in pairwise groups. For example, for H2O-LDS, the former was considered as the control and the latter was considered as the treatment. b: Overlap between the number of differentially expressed unigenes in pairwise groups. The overlapped unigenes are shown in gray. H2O: O. hupensis exposed to H2O for 12 h; LDS: O. hupensis exposed to LDS for 12 h; WPN: O. hupensis exposed to WPN for 12 h.

