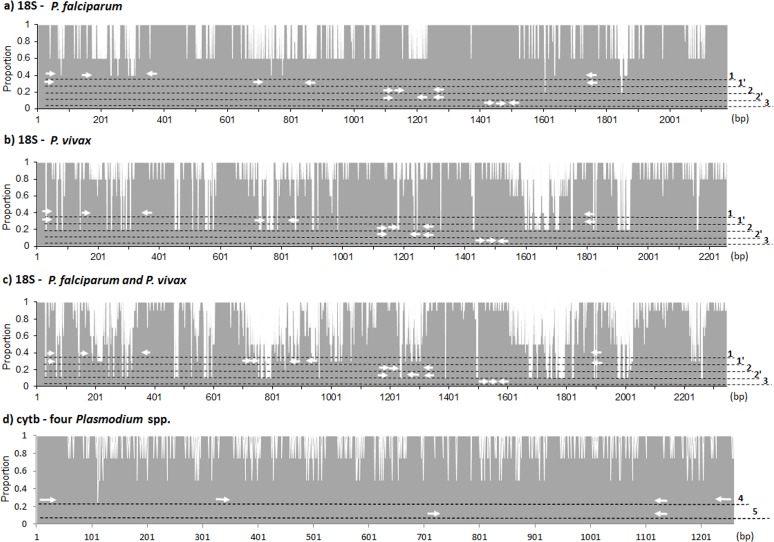
Fig 1. Area chart showing the sequence alignments of target genes, primers and probes.
a) Five copies of the 18S rRNA gene in the P. falciparum genome. b) Five copies of the 18S rRNA gene in the P. vivax genome. c) Combined ten copies of the 18S rRNA gene in the P. falciparum and P. vivax genomes. d) The cytb genes of P. falciparum, P. vivax, P. malariae, and P. ovale. Identical sequences are shown in grey in the chart area. Nucleotide base pair position is shown on the X-axis and the proportion of sequences in consensus is shown on the Y-axis. Primer and probe positions of respective PCRs are indicated using white arrows along the dashed lines (1, 18S-nPCR pan-Plasmodium primers; 1’, 18S-nPCR species-specific primers; 2, 18S-qPCR-R pan-Plasmodium primers and probe; 2’, 18S-qPCR-R species-specific primers and probes; 3, 18S-qPCR-K; 4, cytb-nPCR; and 5, cytb-qPCR).

