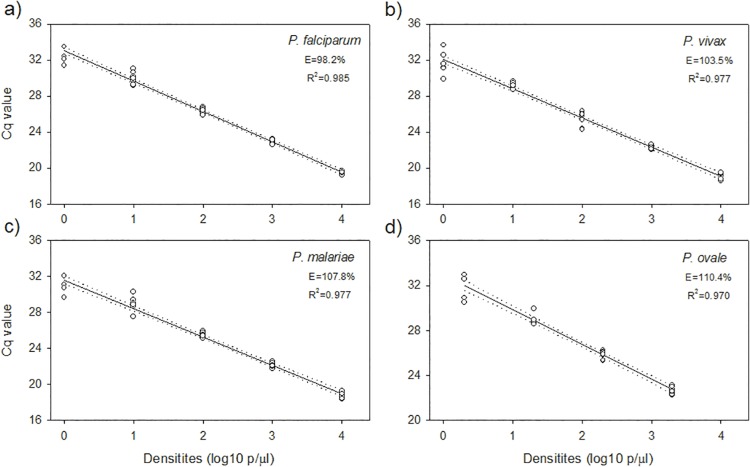
Fig 3. The cytb-qPCR standard curves derived from tenfold dilution series of P. falciparum, P. vivax, P. malariae, and P. ovale samples.
The cytb-qPCR efficiency (E) and coefficient of determination (R2) of the standard curves were calculated for each species. The cytb qPCR was conducted in eight replicates (4 extractions × 2 cytb-qPCRs). Dashed lines represent 95% CI.

