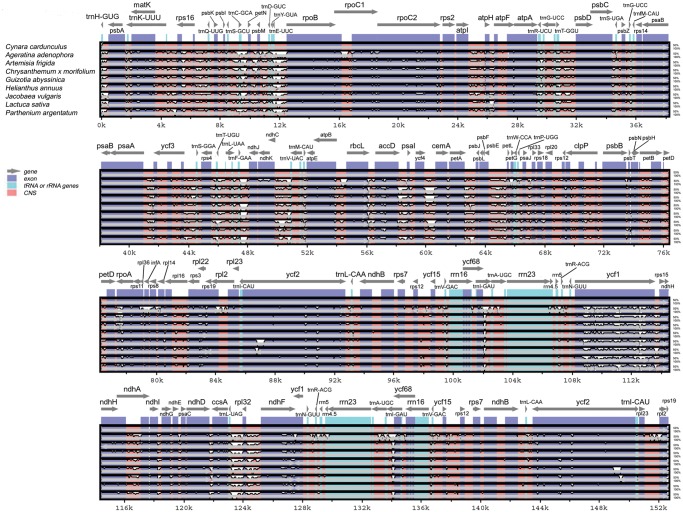
Fig 3. Visualization of alignment of nine Asteraceae cp genome sequences.
VISTA-based identity plot showing sequence identity among eight cp genomes already published (see Materials and Methods for accession numbers) and the artichoke cp genome, set as a reference. Sequence identity is shown as a percentage between 50–100% on y-axis. On x-axis, artichoke genes are indicated on top lines, and arrows represent their orientation. Genome regions are distinguished by colors. CNS: conserved non-coding sequences.

