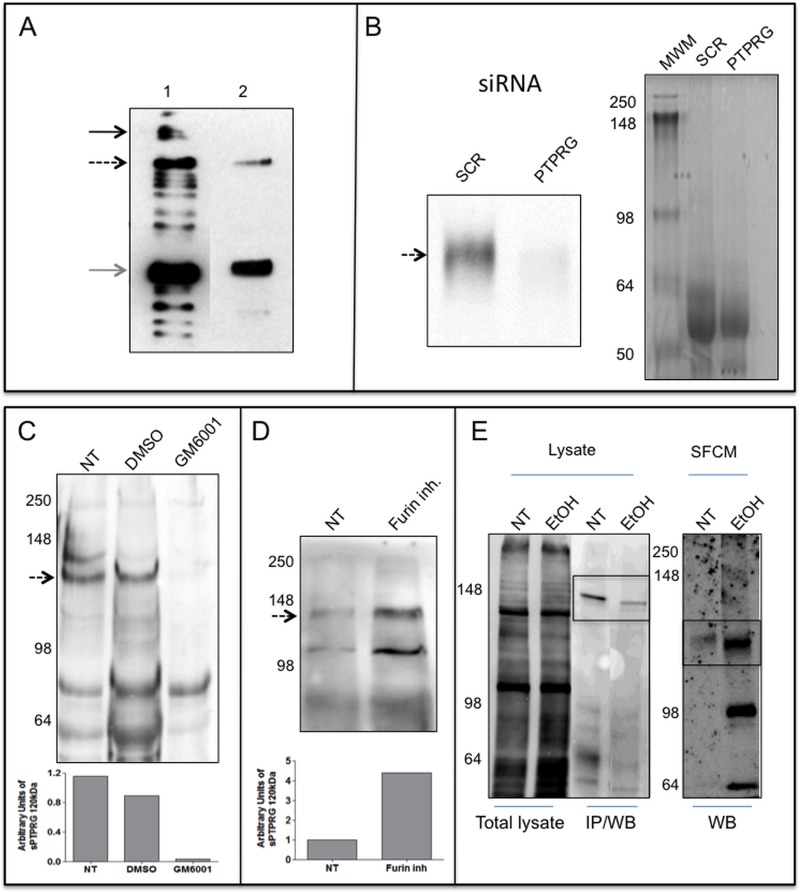
Fig 5. Expression and release of PTPRG by HepG2 cells.
Panel A: WB with Rb anti-P4 of total lysate and supernatant of HepG2 cell line. Lane 1: 10 μg total cell lysate of HepG2 cell line. Lane 2: serum-free conditioned medium of HepG2 after 100000×g ultra-centrifugation and TCA precipitation. Black arrow: full-length protein, dashed arrow: ∼120 kDa isoform, gray arrow: ∼90 kDa isoform. Panel B: WB with Rb anti-P4 of serum-free conditioned medium of HepG2 cells showing down regulation of sPTPRG by siRNA (siRNA PTPRG) in comparison with a scrambled sequence (SCR). Coomassie blue staining of serum-free conditioned samples demonstrating the loading on comparable amounts of material in both lanes. Panel C: serum-free conditioned medium (SFCM) of HepG2 cells. Left: Molecular weight marker. NT: untreated cells, DMSO: cells treated with vehicle (DMSO), or overnight with 12 μM metalloproteinase inhibitor GM6001 (Ilomastat). Densitometric analysis of sPTPRG 120 kDa isoform related to a common aspecific band approximately at 70 kDa present in all samples (below). Panel D: cells treated overnight with 50 μM furin inhibitor. Dashed arrow: ∼120 kDa isoform. Below is the densitometric analysis expressed as fold increase versus control of the ∼120 kDa band normalized against the total protein load. WB was performed with a chicken anti-PTPRG antibody[27]. Panel E: WB with streptavidin-HRP of cell-surface biotinylated HepG2 cells untreated (NT) or treated (EtOH) for 16 hours with 50 mM ethanol, lysed and immunoprecipitated with anti-P4 antibody (IP/WB, bands boxed). Lower levels of full length PTPRG is present in EtOH treated cells. The same antibody was used in WB analysis on the corresponding serum-free conditioned media precipitated with TCA/acetone (right panel, boxed). The ∼120 kDa PTPRG isoform was detectable in SFCM at higher levels in comparison with untreated cells. The first two lanes represent total cell lysate before IP and demonstrate equal amount of protein and comparable surface biotin labeling of the two samples.

