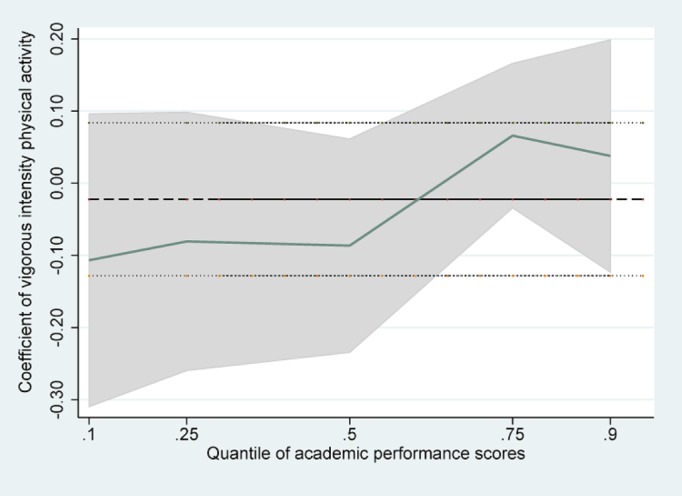
Fig 2. Quantile regression estimates of VIPA.

Y axes represent coefficient estimates of physical activities over the distribution of Academic performance scores; X axes indicates the quantiles of the dependent variable. The dashed line is the OLS estimate for physical activities and the dotted lines are the 95% confidence interval bounds. The shaded areas represent the 95% confidence intervals for the quantile regression estimates (100 bootstrap replications).
