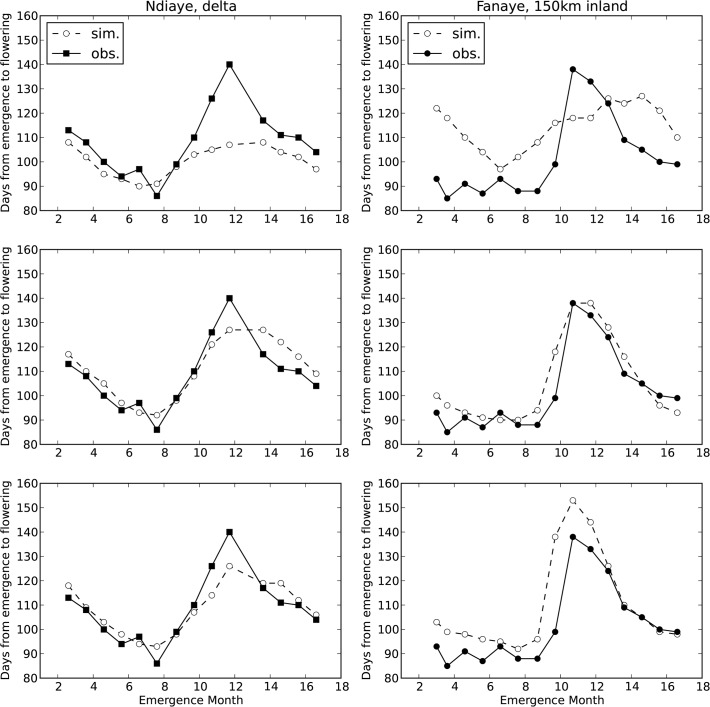
Fig 5. Simulated duration from emergence to flowering.
Top: with default cardinal temperatures (Table 2, s8). Middle: with optimised cardinal temperatures (Table 2, s9) and Bottom: with RIDEV model (Table 2, s17). X-axis starts on the left (Ndiaye) mid februari 2006 and on the right (Fanaye) early march 2006. Month 14 corresponds with month 2 (February) of the next year 2007, 16 is April 2007.

