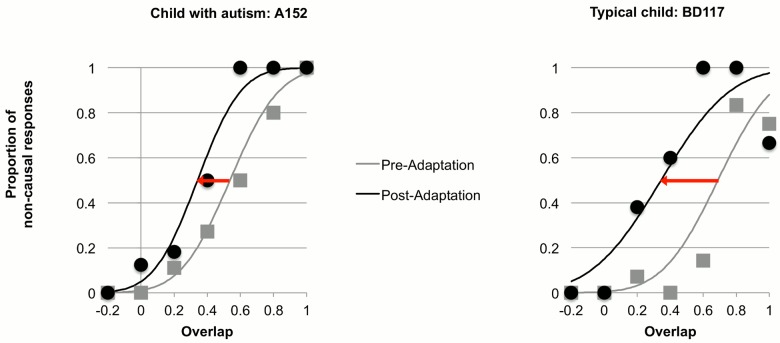
Fig 2. Example data and fitted psychometric functions in the pre- and post- adaptation testing conditions from the group of children with autism (left) and the group of comparison children (right).
Proportion of non-causal (pass) responses is plotted as a function of surface overlap during the test event (Fig. 1D). The data were fitted with cumulative Gaussian error functions, whose means estimated PSE and standard deviations estimated precision. Red arrows indicate the shifting of psychometric functions during the post-adaptation phase.

