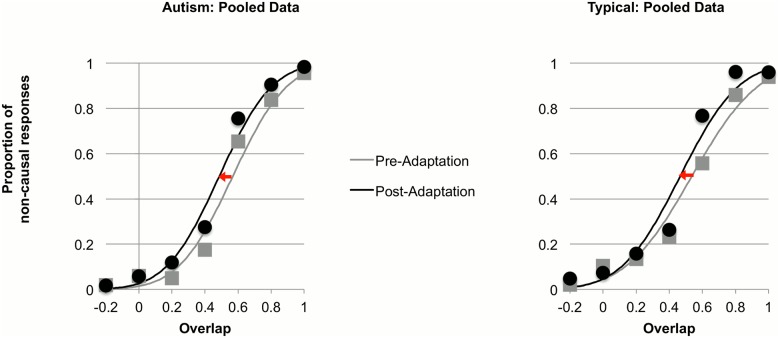
Fig 3. Pooled data across all participants within the group of children with autism (left) and the group of comparison children (right), and fitted psychometric functions in the pre- and post-adaptation testing conditions.
Proportion of non-causal responses is plotted as a function of surface overlap during the test event (Fig. 1D). Red arrows indicate the shifting of psychometric functions during the post-adaptation phase.

