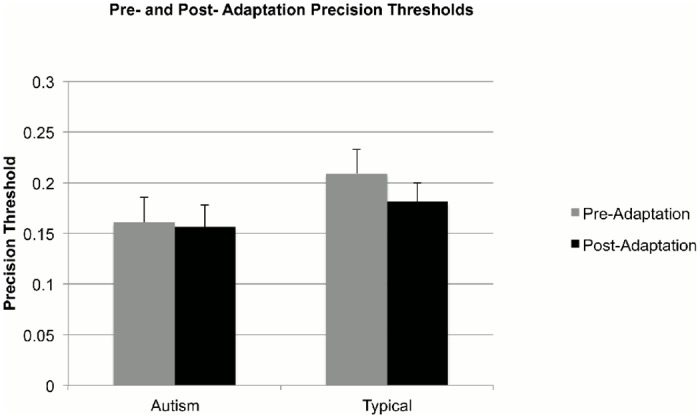
Fig 5. Mean precision for perception of causality (mean of standard deviations of the fitted psychometric curves) in the pre- and post-adaptation conditions for the group children with autism (left) and the group of typically developing comparison children (right).

Error bars correspond to ± 1 SEM.
