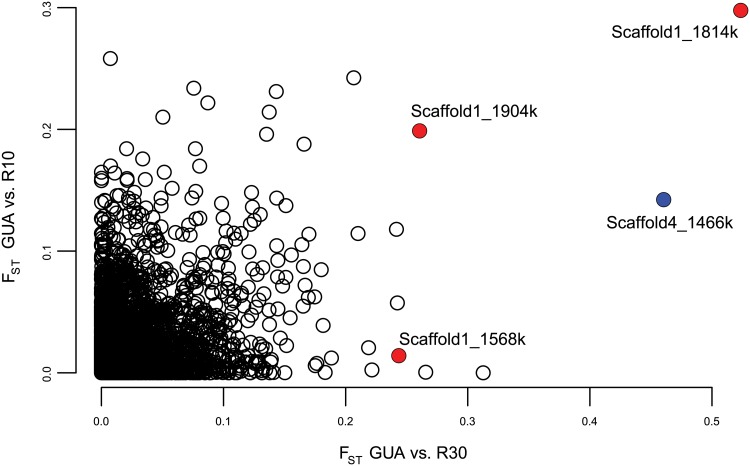
Fig 2. FST values between the unselected control line (GUA) and each selected line (R10 and R30).
Three null RAD markers, aligned with BWA [65] to Scaffold1, all showed unusually high FST in one or both comparisons (red). These markers conform to perfect linkage disequilibrium with the haplotypes as determined by Sanger sequencing, with the different FST values owing only to the error inherent in estimating allele frequencies from null markers. An additional unaligned marker with high FST in both comparisons was identified with Stacks [35] and found to reside on Scaffold4 (blue).

