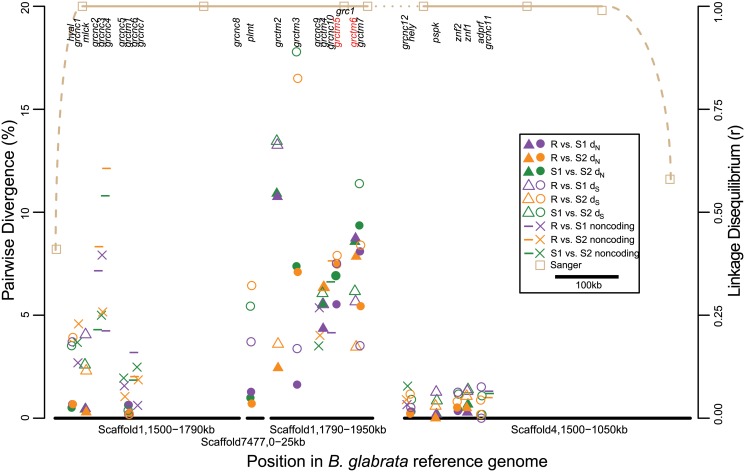
Fig 3. Pairwise divergence of GRC genes.
Genes are aligned to their approximate genomic position on the x-axis, staggered slightly for ease of visualization. Scaffold7477 has been inserted into its inferred position within Scaffold1. Scaffold4 has been inverted relative to its arbitrarily designated reference genome orientation to indicate that only the end of this scaffold is part of the GRC. Pairwise divergence for all three haplotype combinations (indicated by color) is shown in the left y-axis. Gene symbols vary for ease of distinguishing adjacent genes, and to show divergence type: solid symbols represent nonsynonymous divergence (dN) in coding genes, open symbols represent silent (synonymous and noncoding) divergence in coding genes (dS), and other symbols represent divergence in noncoding genes. Only the six TM1 genes in the center of the region of association (grctm2–7) show high (>1%) dN. The names of the two most promising candidates, grctm5 and grctm6, are highlighted in red. Brown lines and squares indicate the boundaries of the GRC region of statistical association as determined by Sanger sequencing markers: for these markers, the right y-axis indicates linkage disequilibrium correlation (r; Table 1) with marker locus grc1 (labeled). The gap between Scaffold1 and Scaffold4 (dotted line) is of unknown size, but contains no expressed genes with sequence or expression differences among haplotypes, as these would have been detected in our RNA-Seq analysis.

