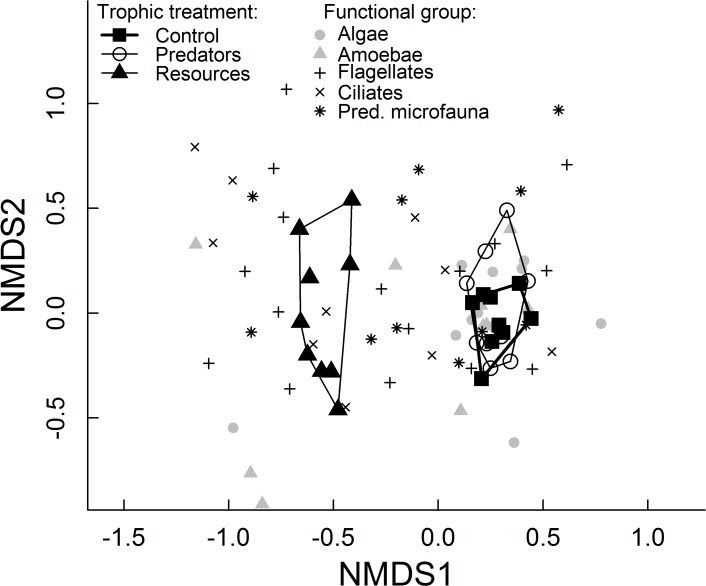
Fig 3. Non-metric multidimensional scaling (NMDS) representation of community- and species responses to nutrient and predator addition.
Average microfauna communities are shown as large symbols with contours drawn around communities of the same trophic treatment (total n = 27). Species are depicted by smaller symbols coded according to their functional group identity. Stress = 0.10, non-metric fit R2 = 0.99, linear fit R2 = 0.95.

