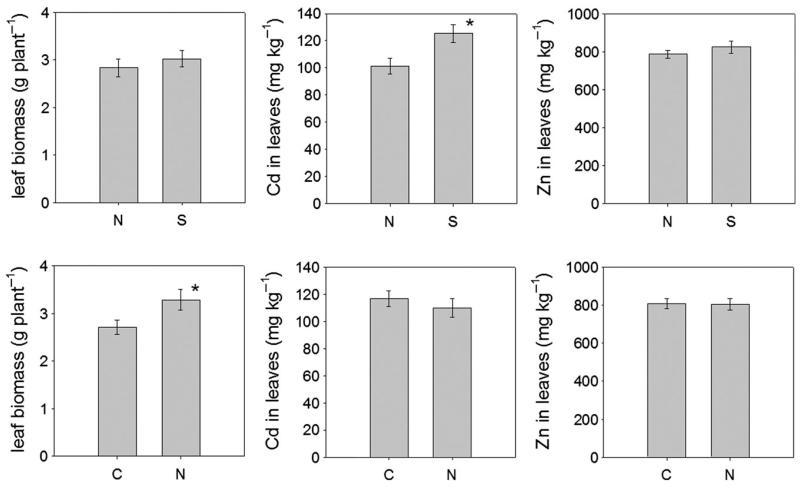
Figure 5.
Comparison of leaf biomass and Zn/Cd concentration of Salix caprea between isolates from Northern (N) and Southern (S) populations as well as between specimen from contaminated (C) and non-contaminated (N) sites. Error bars represent the standard error of the mean.A significant difference (P < 0.05) is indicated by an asterisk.

