Fig. 1.

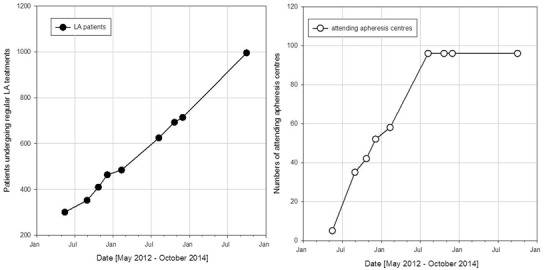
Number of documented patients (left) and participating centres (right) over the time period from May 2012 to October 2014

Number of documented patients (left) and participating centres (right) over the time period from May 2012 to October 2014