
Fig. 4.
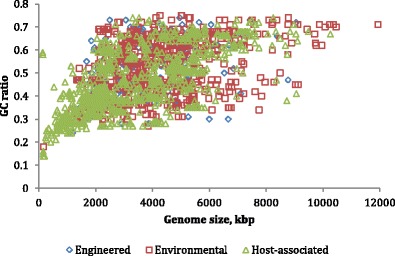
Genome size and percent GC of 2139 finished genomes plotted for the ecosystem types of (1) engineered systems, (2) environmental sources, and (3) host-associated genomes. Source: GOLD, accessed 4 February 2015
Official websites use .gov
A
.gov website belongs to an official
government organization in the United States.
Secure .gov websites use HTTPS
A lock (
) or https:// means you've safely
connected to the .gov website. Share sensitive
information only on official, secure websites.
Genome size and percent GC of 2139 finished genomes plotted for the ecosystem types of (1) engineered systems, (2) environmental sources, and (3) host-associated genomes. Source: GOLD, accessed 4 February 2015