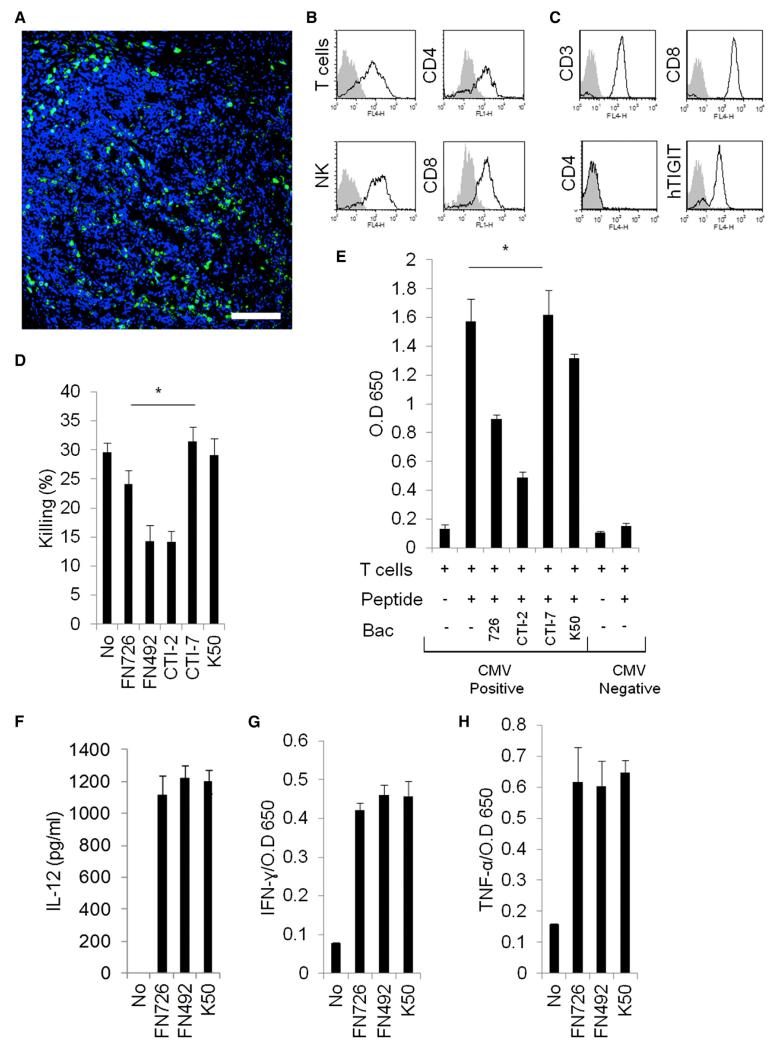
Figure 7. F. nucleatum Inhibits T Cell Activity.
(A) Immunofluorescence microscopy of frozen sections derived from colon adenocarcinomas stained with anti-TIGIT mAb #1 (green) and DAPI (blue). Scale 100 μm.
(B) Tumor infiltrating lymphocytes were isolated from colon adenocarcinomas. The figure shows TIGIT expression (empty histograms) on the indicated tumor infiltrating lymphocytes: T cells, CD4+ T cells, CD8+ T cells, and NK cells. The filled histogram represents staining with control antibodies (APCconjugated for the T and NK cells and FITC-conjugated for the CD4+ and CD8+ cells). The backgrounds were set on the entire lymphocyte population including both T and NK cells.
(C) Characterization of melanoma tumor-derived TIL #14. TIL-14 was stained with mAbs as indicated in the figure. The filled histogram represents the staining with control antibodies.
(D) TIL #14 cytotoxicity assays were performed on 35S-labeled autologous melanoma #14 cells incubated without or with the various bacteria indicated on the x axis. The bacteria:cell ratio was 600:1. The E:T ratio was 5:1. *p < 0.05. The error bars are derived from triplicates.
(E) Lymphocytes isolated from CMV positive and CMV negative donors (indicated on the x axis), were incubated with or without a mixture of pp65 overlapping peptides and with or without the bacteria as indicated on the x axis. Incubation was performed for 48 hr and IFN-γ in the supernatants was determined by ELISA. *p < 0.005. The error bars are derived from triplicates.
(F) DC were incubated with or without the F. nucleatum strains indicated on the x axis at a bacteria to DC ratio of 100:1. IL-12 in the supernatants was determined by ELISA 48 hr later. The error bars are derived from triplicates.
(G and H) The supernatants obtained from (F), indicated on the x axis, were incubated with primary NK cells and the presence of IFN-γ (G) or TNF-α (H) in the supernatants was determined 48 hr later. The error bars are derived from triplicates.

