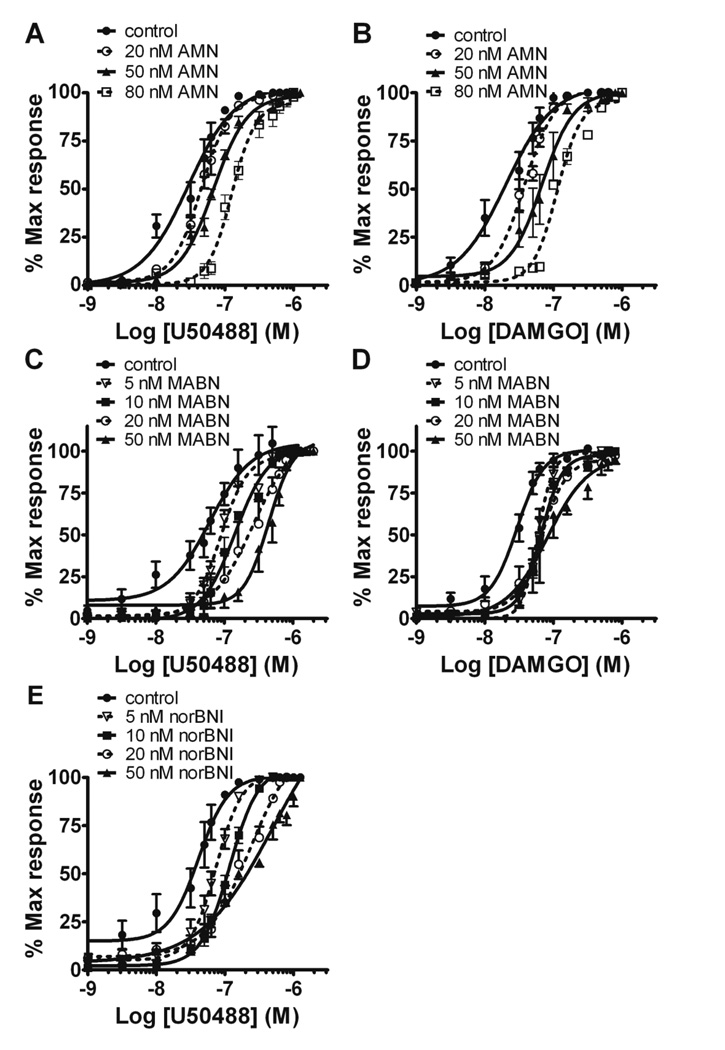
Figure 1.
Cumulative concentration-response curves, in the isolated guinea-pig ileum for U50,488 and DAMGO, in the presence of increasing concentrations of 5’-AMN (AMN; A, B), 5’-MABN (MABN; C, D), and norBNI (E). All ligands tested caused rightward parallel shifts of agonist concentration-response curves. The results are expressed as the mean percentage of the maximum response induced by the agonist ± SEM, n=4 tissues.

