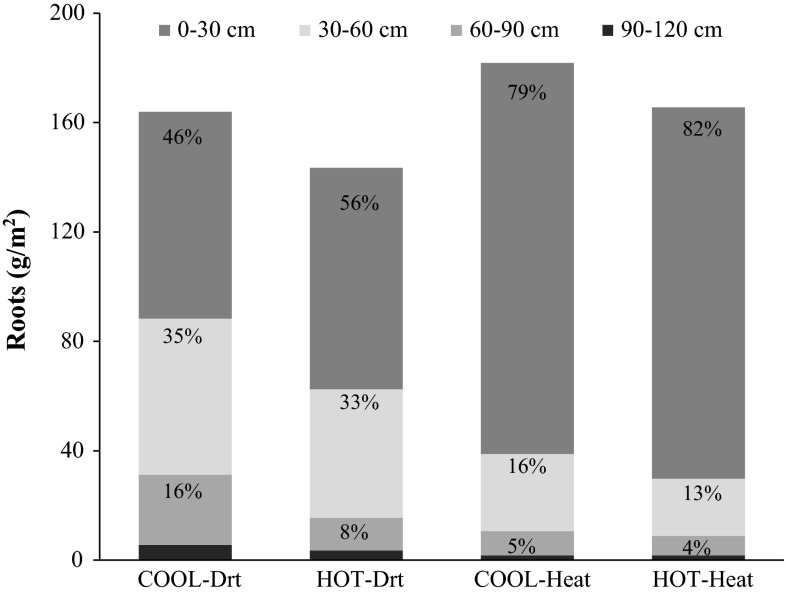
Fig. 3.
Root distribution across the whole soil profile (0–120 cm depth) in Seri/Babax bread wheat is presented as the average of 2 years for each environment. T-tests revealed COOL and HOT genotypes differed significantly for the following profiles: under Drt, 30–60 cm (p = 0.04), 60–90 cm (p = 0.0002), 30–90 cm (p = 0.0013), 30–120 cm (p = 0.0018) and 60–120 cm (p = 0.0016); under heat, 30–60 (p = 0.0003), 30–90 (p = 0.0022), 30–120 (p = 0.0031). Percentages are the proportion of roots in each profile relative to the total amount of roots produced at 0–120 cm; the proportion in the 90–120 cm profile was <3 % for both groups under Drt and Heat

