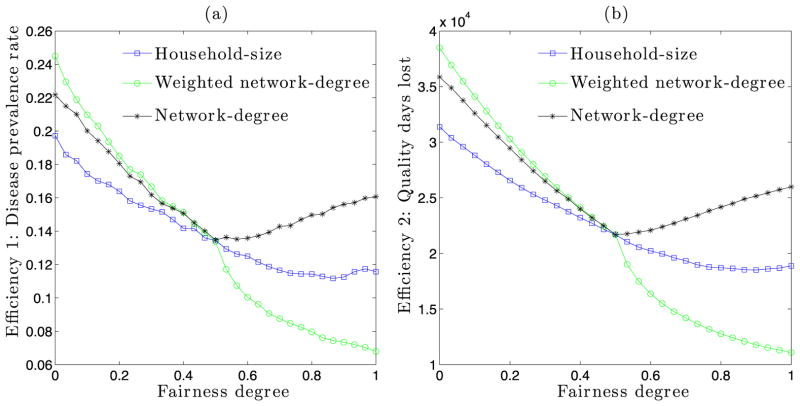
Figure 3.
Relationship between (negative) efficiency and fairness of vaccine allocation strategies. Subfigure (a) uses disease prevalence rate as the efficiency measure and subfigure (b) uses the quality days lost. Simulations are run on a synthetic social network of Montgomery County in Southwest Virginia. Only 20% of the population gets vaccinated. Vaccine efficacy is set at 90%.

