
Fig. 5.
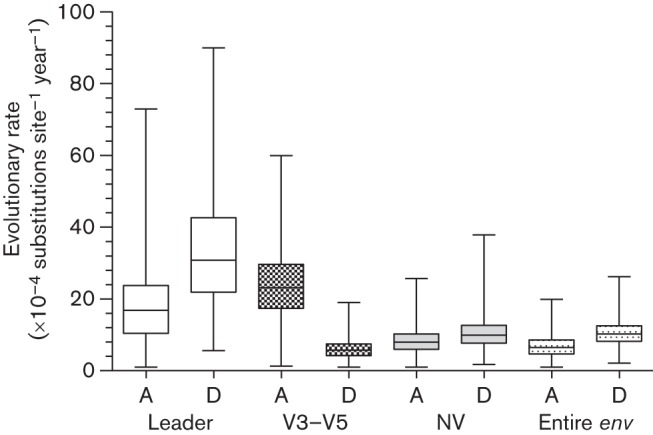
Comparison of evolutionary rates of the leader, V3–V5, NV fragments and the entire env genes from six alive (healthy, A) and 11 deceased (unhealthy, D) cats from the Memphis cohort during the 12 month observation period. Rate estimates were either based on strict or relaxed clock models (for details, see Table S3).