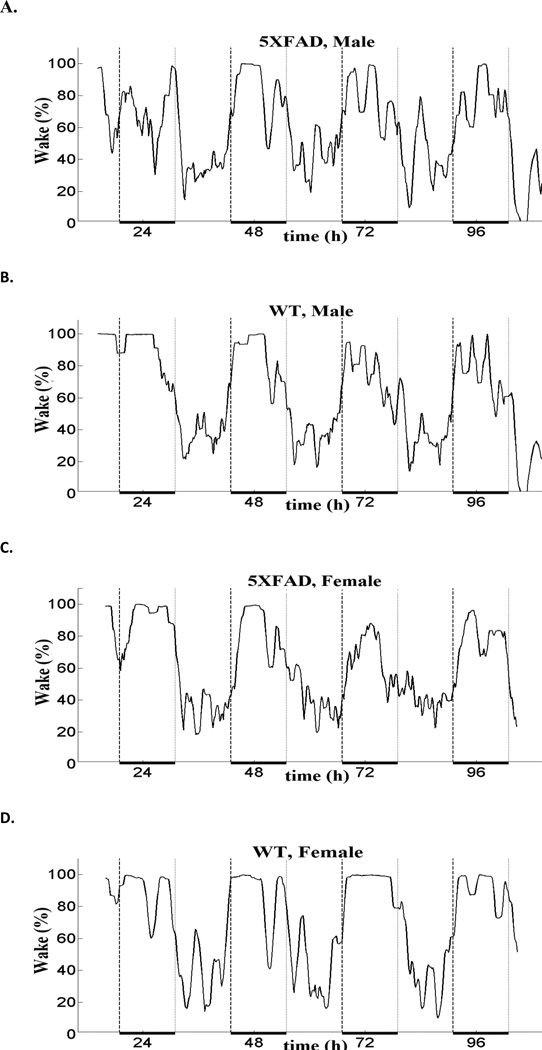
Fig. 2.
Representative sleep-wake profiles for 5XFAD mice (A and C) and control littermates (B and D). The percent wake plotted on the Y axis is represented as a sliding average over a 2 hour window. Hours of recording are plotted on the X-axis where 0 represents the midnight of day 1. Broken vertical lines demarcate the dark phase, which is also indicated by a heavy horizontal black line at the bottom.

