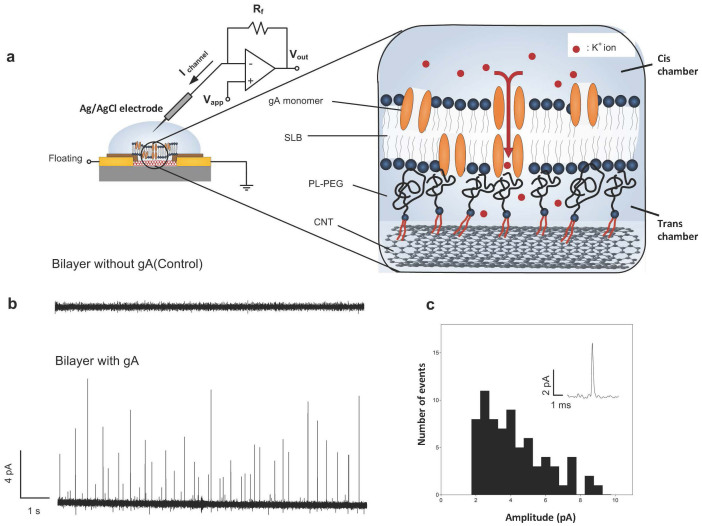
Figure 2. Ion channel recordings.
(a) Schematic of ion channel recording set-up showing a simplified equivalent circuit of patch clamp amplifier. Inset: The interface between SLBs with gA and CNTs linked with PL-PEG polymer linkers. (b) Ion channel current trace (top) before gA insertion (bottom) after introduction of gA (cutoff frequency: 1 KHz, sampling: 20 KHz, Vapp = +50 mV). 100 mM KCl in 1× PBS solution was used for recording. (c) Histogram of ion channel events; Inset: a zoomed-in typical event.

