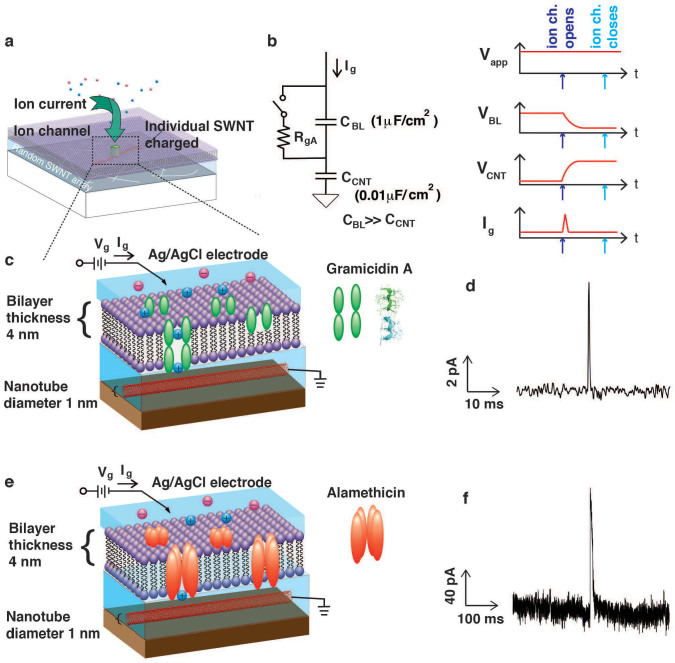
Figure 3. Circuit and schematic interpretation.
(a) Schematic 3d representation showing a single ion channel opening, and the current charging a single nanotube in the matt. (b) Circuit and time domain behavior of essential elements of ion channel opening and closing. (c) Schematic representation of gramicidin opening and closing. The nanotube and lipid bilayer are to scale. The functionalization layer is not shown, and represented in the next figure. gA protein structure from PDB ID: 1 grm51. (d) Representative current spike with gA. (e,f) As for (c,d) but with alamethicin. 100 mM KCl in 1× PBS buffer was used for recording.

