
Figure 1. Electrical transport properties of single-crystalline LuPdBi.
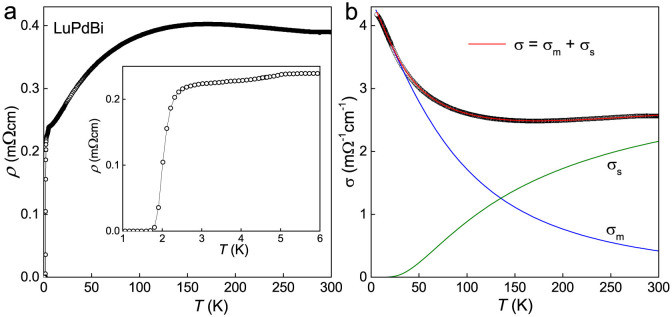
(a) Temperature dependence of the electrical resistivity up to 300 K. Inset: low-temperature resistivity data revealing a superconducting transition near 2 K. (b) Temperature dependence of the electrical conductivity in the normal state fitted by the function σ(T) = σm(T) + σs(T) (red line) described in the text. The metallic and semiconducting contributions are represented by blue and green curves, respectively.