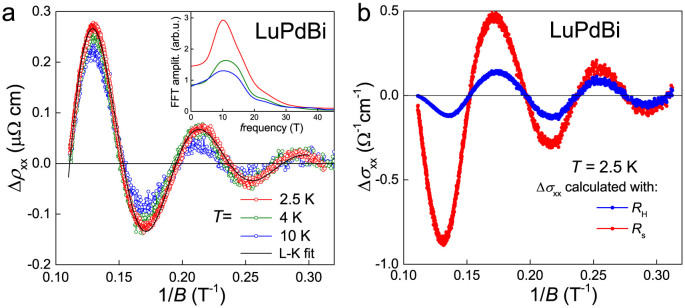
Figure 7. Shubnikov–de Haas oscillations in LuPdBi.

(a) Oscillatory component of the electrical resistivity as a function of inverse magnetic field, measured at different temperatures. Black solid line represents a fit of 2.5 K data with L-K formula. Inset: FFT spectra obtained for different temperatures. (b) Oscillatory component of longitudinal electrical conductivity at T = 2.5 K calculated with macroscopic Hall resistivity (blue line) or surface channel Hall resistivity (red line).
