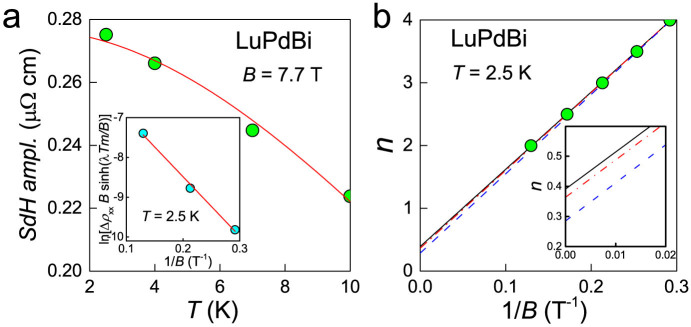
Figure 8. Analysis of the SdH oscillations in LuPdBi.

(a) Lifshitz-Kosevich description (solid line) of the temperature dependence of the SdH amplitude. Inset: Dingle plot for the oscillations measured at 2.5 K. Solid straight line determines the Dingle temperature (see the text). (b) Landau-level fan diagram for the SdH oscillations measured at 2.5 K. Fitted straight solid line intersecting the ordinate axis at 0.4 indicates the Berry phase very close to π. Dashed (blue) line represents the fit to extrema in conductivity Δρxx derived with macroscopic Hall coefficient, RH. Dot-dashed (red) line corresponds to Δσxx derived with Hall coefficient of surface channel Rs (see text for explanation). Inset shows the blow up of the area where the fitted lines intercept ordinate axis.
