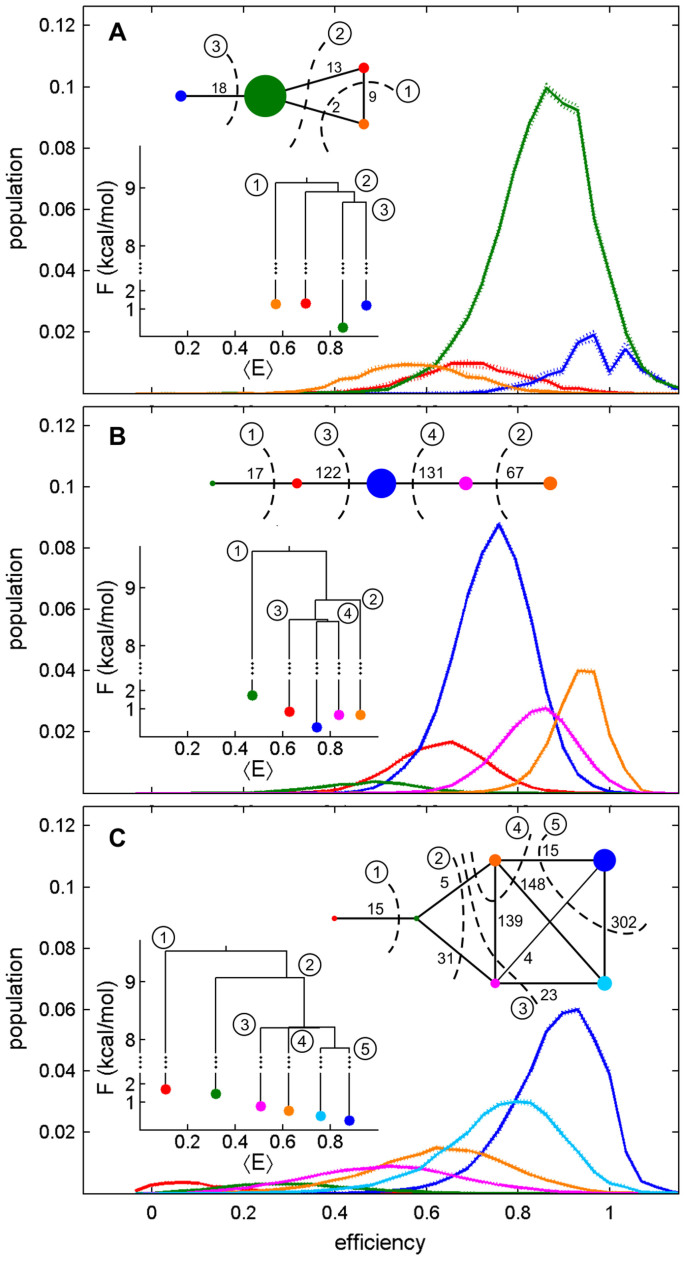
Figure 2. Results for the AMPA ABDs showing state distributions, state space networks, and TRDGs for the (A) glutamate-bound ABDs, (B) nitrowillardiine-bound ABDs, and (C) the UBP282-bound ABDs.
Sizes of the nodes in the networks are proportional to the population of each state with the exception that all states having population < 10% of the most populous state have the same size. Each edge in the networks is labeled with the number of transitions along the edge. The colors of all nodes correspond to the colors of the state distributions in each panel. The networks and the TRDGs are labeled with circled numbers indicating the sequence of dividing surfaces used to construct the TRDGs.

