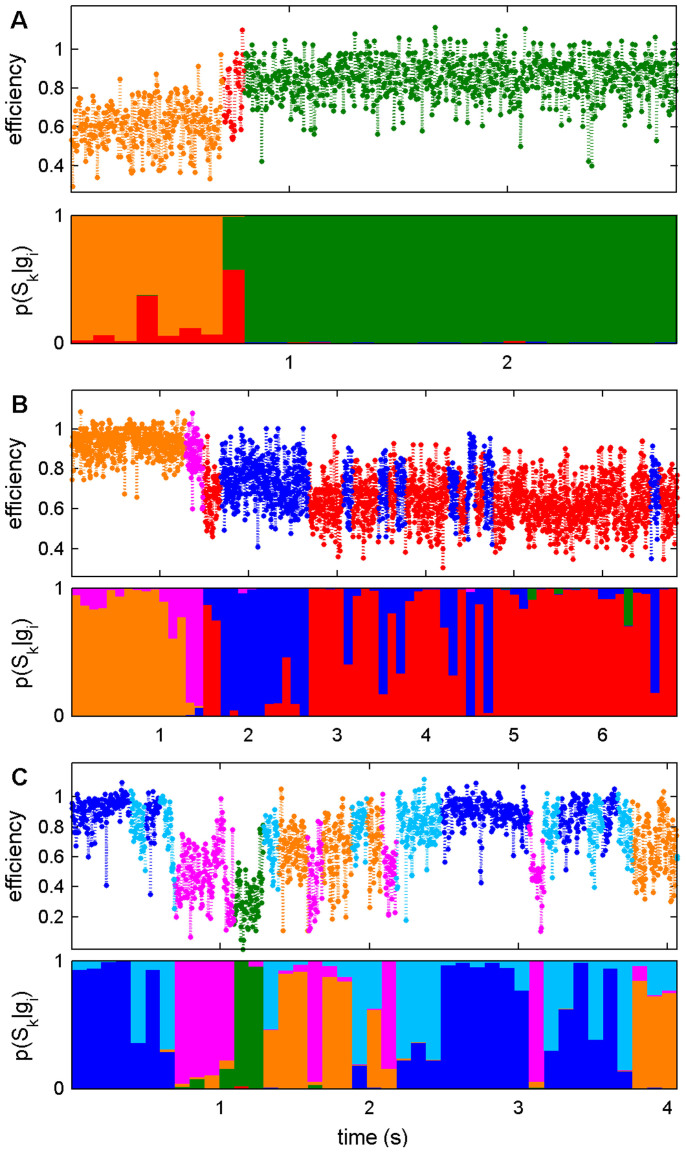
Figure 3. Representative trajectories of the AMPA ABDs for the (A) glutamate-bound, (B) nitrowillardiine-bound, and (C) UBP282-bound conditions.
Segments in the upper sub-panels are colored with the color of their most probable states. Bar heights in the lower sub-panels correspond to the magnitude of the p(Sk|gi). All colors correspond to those used in Figure 2.

