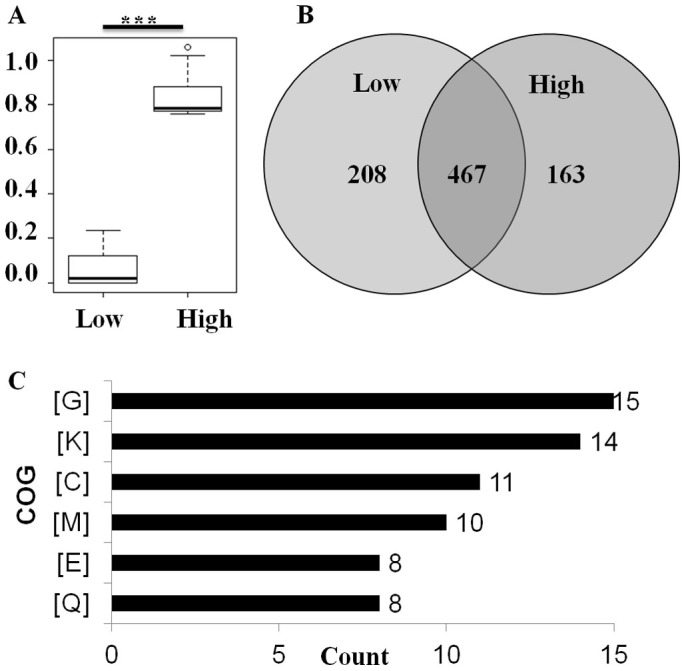
Figure 3. Identification and analysis of ε-PL yield-related genetic variants.

(A) Box plot of the PL yield in the group-L and group-H mutant strains. Significance between the two groups is indicated by asterisks. (B) Venn diagram showing the genetic variants identified from the Low- and High-groups. (C) COG classifications of genes with non-synonymous mutations. [G]: Carbohydrate transport and metabolism; [K]: Transcription; [C]: Energy production and conversion; [M]: Cell wall/membrane/envelope biogenesis; [E]: Amino acid transport and metabolism; and [Q]: Secondary metabolites biosynthesis, transport and catabolism.
