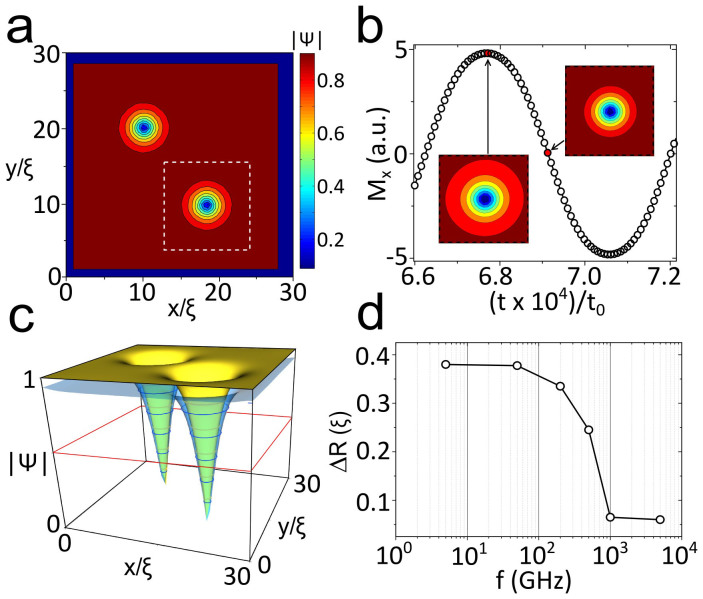
Figure 4. Time dependent Ginzburg-Landau simulations.
(a) Contour plot of |Ψ| in a square sample, with HDC = 0.02Hc2 perpendicular to the sample, after applying HDC = 0.8Hc2 and slowly reducing it. Two vortices are isolated.(b) Oscillation of Mx (component of magnetization in the direction of the ac field, in arbitrary units) as a function of time, following the ac field at 5 GHz. Snapshots of the area marked by dashed white lines in panel (a) show the different size of vortices at times separated by 1/4 of a period. (c) |Ψ| at the whole sample for the two cases considered in (b). Yellow surface corresponds to minimum and blue to maximum of |HDC|. (d) Change of vortex radius (taken at |Ψ| = 0.5, marked by red line in panel (c) as a function of frequency in an oscillation period. At high frequencies the vortices cannot follow the external field and their shape and position almost don't change.

