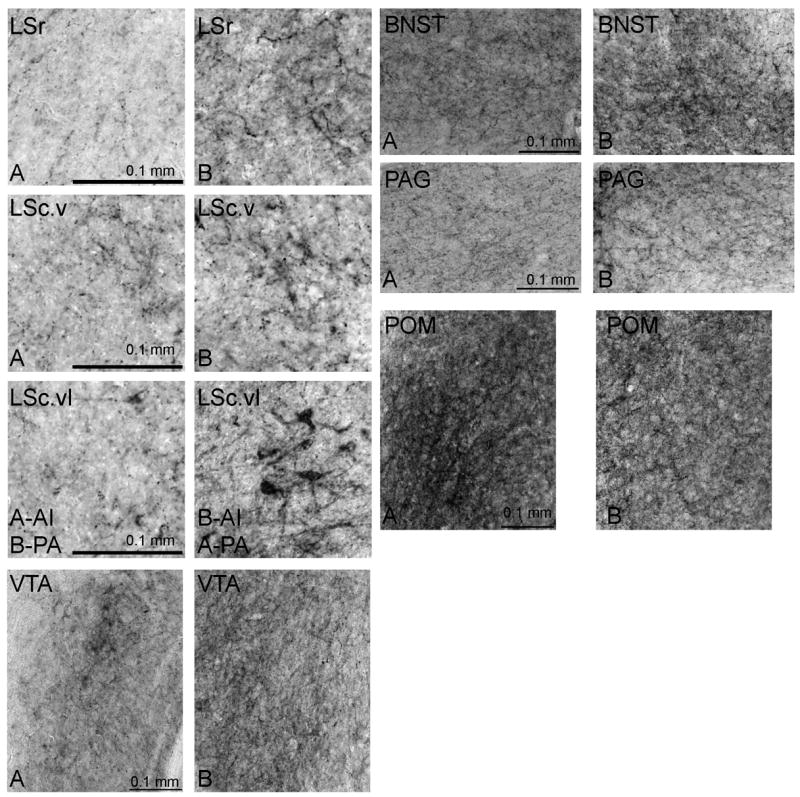
Figure 3.

Photomicrographs of representative NT labeling in LS, BNST, POM, VTA, and PAG in relation to low (A) and high (B) rates of behavior. Relationships are consistent for measures of average intensity (AI) and pixel area (PA) except for LSc.vl, as indicated in the figure. Scale bar is indicated in bottom left of panel A for each region.
