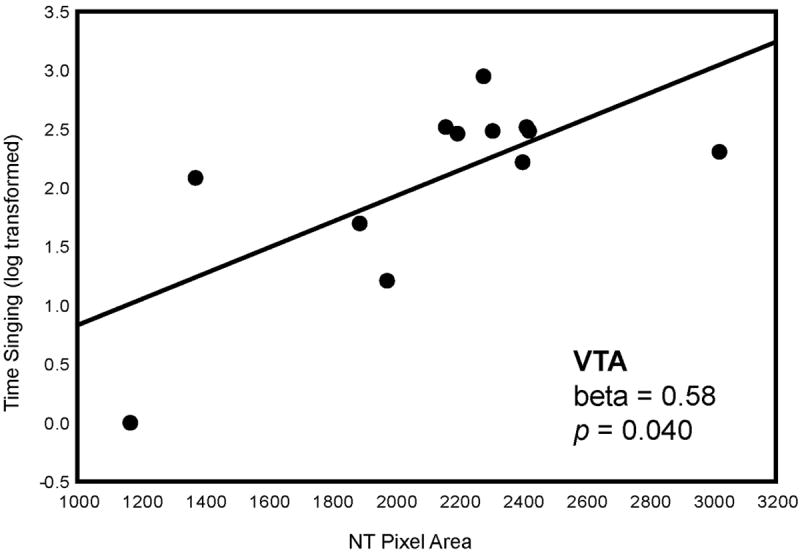
Figure 5.

Two-dimensional visualization of a multiple regression model with 2 significant variables, in this case indicating the relationship between NT pixel area (X-axis) in VTA and time singing (Y-axis). Statistics were computed in a multiple regression model and do not represent values of linear correlations. Each point represents data from a single individual.
