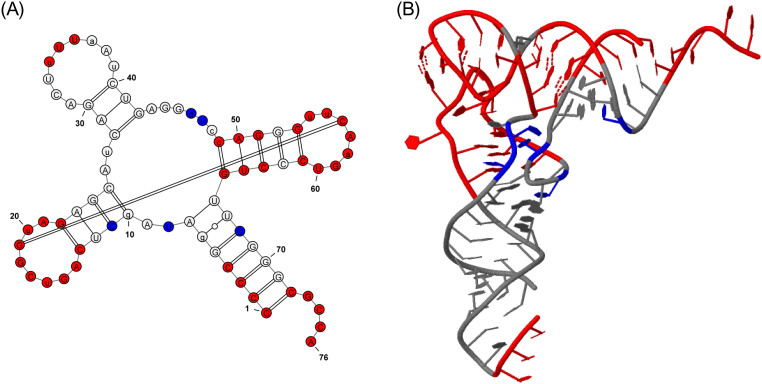
Figure 2. Graphical representation of the tRNA (Lys) functional sites identified by Rsite.
Figure 2A&B show the secondary structure and tertiary structure of the tRNA (Lys). The nucleotides in red color represent the predicted functional sites that hit known functional sites. The nucleotides in blue color stand for the predicted functional sites that are not reported to be functional sites.

