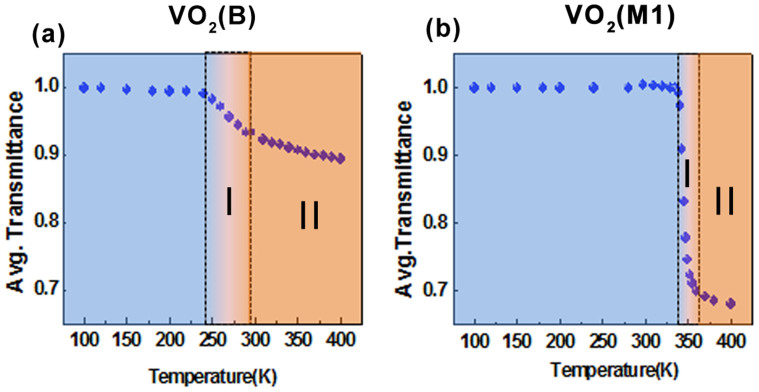
Figure 8.
Normalized and frequency-averaged THz transmission of (a) VO2(B) and (b) VO2(M1) thin films as a function of temperature during the warming process. These values are normalised to the transmission at 100 K. The blue colour regions represent the insulating phases while the pure conducting phases are coloured orange. The two dotted lines mark the intermediate transition state. The conductivity regimes I and II as described in the previous discussions are also labelled.

