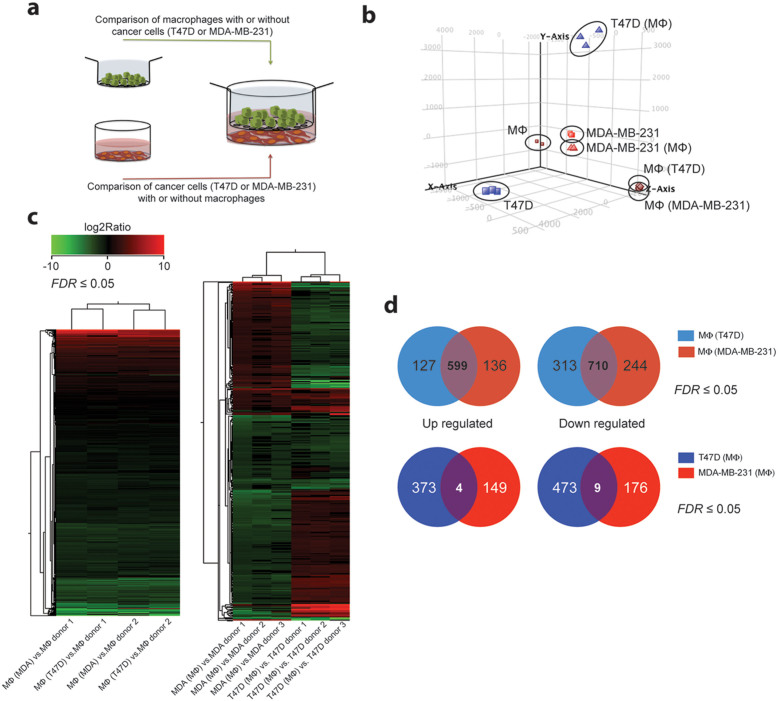
Figure 2. Gene expression changes under T47D and MDA-MB-231 cancer cell - macrophage co-culture conditions.
(a) Experimental setup of whole transcriptome analysis for RNA-seq. (b) Principal component analysis (PCA) of whole transcriptome of individually cultured macrophages (brown squares, n = 2) and of T47D (brown circles, n = 2) or MDA-MB-231 (brown diamonds, n = 2) co-cultured macrophages; individually cultured T47D cells (blue squares, n = 3) and co-cultured T47D cells (blue triangles, n = 3); individually cultured MDA-MB-231 cells (red squares, n = 3) and co-cultured MDA-MB-231 cells (red triangles, n = 3) shows gene expression variance across the samples. 76.8% of the variance of the data is represented in the scatterplot and divided into three components: PC1 explains 52.84% of the variance data (x-axis), PC2 explains 34.47% of the variance of the data (y-axis) while PC3 explains 12.68% of the variance of the data (z-axis). (c) Heat maps of gene expression changes in both co-cultured macrophages and cancer cells compared to single culture conditions, respectively. Unsupervised hierarchical clustering was performed on the log2 ratio of significantly (FDR < 0.05) up- (red) and down- (green) regulated genes, using Euclidean distance matrix and average linking. (d) Venn diagrams summarizing differentially expressed genes after T47D (n = 2, light blue) or MDA-MB-231 (n = 2, light red) co-culture in macrophages (upper circles) and in T47D (n = 3, blue) and MDA-MB-231 (n = 3, red) cells after co-culture with macrophages (lower circles). Up-regulated genes: log2Ratio ≥ 1.5, FDR ≤ 0.05; down-regulated genes log2Ratio ≤ −1.5, FDR ≤ 0.05.

