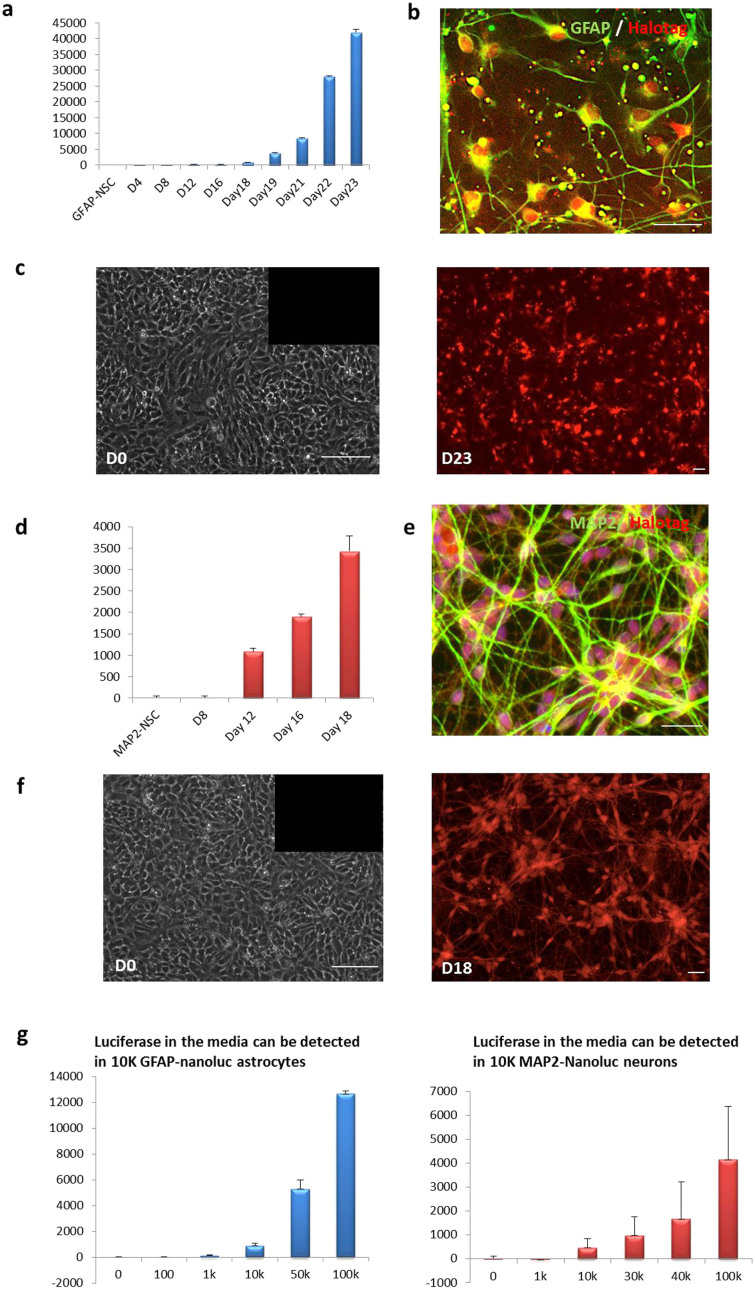
Figure 4. Functional validation of lineage-specific expression.
(a) An increase of luciferase level in culture media was detected in the GFAP-Nanoluc-KI cell lines during directed differentiation into astrocytes. Luciferase levels shown in the bar graph were normalized by the basal level detected at day 0 in GFAP-Nanoluc-KI NSC. (b) Immunostaining showed excellent co-localization of HaloTag (red) and GFAP (green) antibodies in the GFAP-Nanoluc-KI astrocytes (D23 post differentiation). (c) Live staining of HaloTag (red) in the GFAP-Nanoluc-KI cell line before (left) and after (right) directed differentiation into astrocytes. (d) An increase of luciferase level in culture media was detected in the MAP2-Nanoluc-KI cell lines during directed differentiation into neurons. Luciferase levels shown in the bar graph were normalized by the basal level detected at day 0 in the MAP2-Nanoluc-KI NSC. (e) Immunostaining showed excellent co-localization of HaloTag (red) and MAP2 (green) antibodies in the MAP2-Nanoluc-KI neurons (D18 post differentiation). (f) Live staining of HaloTag (red) in the MAP2-Nanoluc-KI cell line before (left) and after (right) directed differentiation into neurons. (g) A series dilution of GFAP-Nanoluc-KI (left) and MAP2-Nanoluc-KI (right) iPSC were plated and luciferase level from the media was tested. The minimum cell amount needed was 10 K for detectable luciferase level of both GFAP-Nanoluc-KI and MAP2-Nanoluc-KI iPSC lines. Scale Bars shown in this Fig are all 100 μm.

