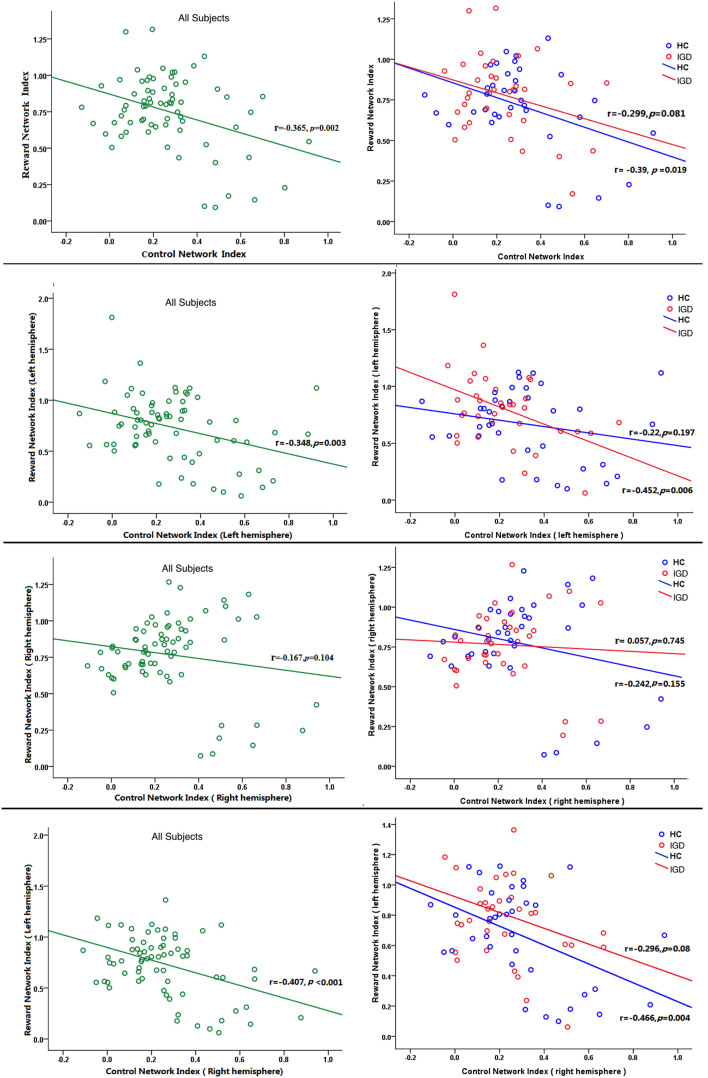
Figure 4. The relationship between control network and reward network indices in all subjects (left), IGD (middle) and HC groups (right), respectively.
Different rows show different comparisons: the whole brain (first row), left hemisphere (second row), right hemisphere (third row), and between-hemispheres (fourth row).

