
Fig. 1.
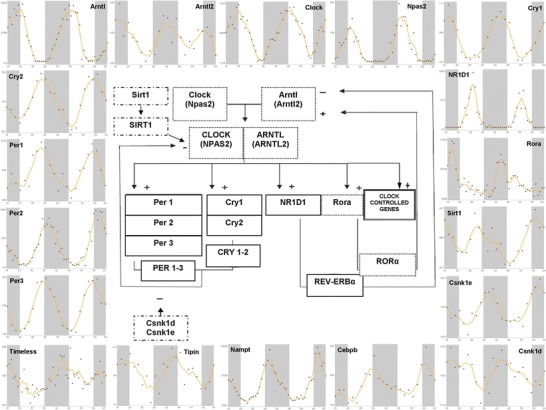
x–y plots showing the time-qualified profile of expression of core clock genes and clock-controlled genes (source: CircaDB, web addresses http://circadb.org, http://github.com/itmat/circadb, http://bioinf.itmat.upenn.edu/circa) and a scheme rendering the interactions among the cogwheels of the molecular clockwork. Continuous line boxes indicate transcriptional repressors such as PER, CRY, and REV-ERBα; dotted line boxes indicate transcriptional activators such as CLOCK, BMAL1, and RORα; dashed-dotted line boxes indicate posttranslational modifications catalyzed by SIRT1 and casein kinases such as CSNK1D and CSNK1E. On the x axis is represented time in hours, on the y axis are represented the mRNA relative expression levels in arbitrary units