
Fig. 4.
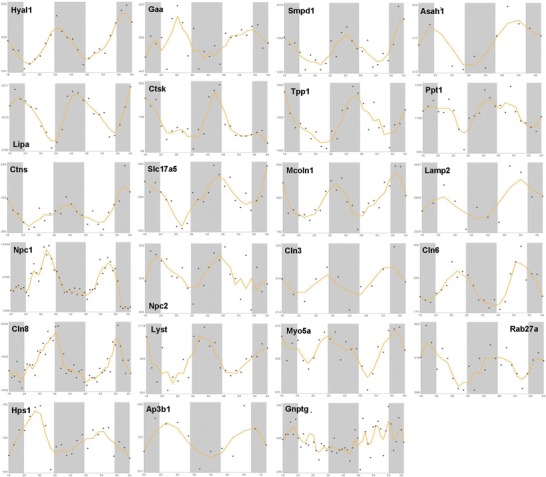
x–y plots showing the time-qualified profile of expression of clock-controlled genes whose mutation causes LSDs (source: CircaDB, web addresses http://circadb.org, http://github.com/itmat/circadb, http://bioinf.itmat.upenn.edu/circa). On the x axis is represented time in hours, and on the y axis are represented the mRNA relative expression levels in arbitrary units