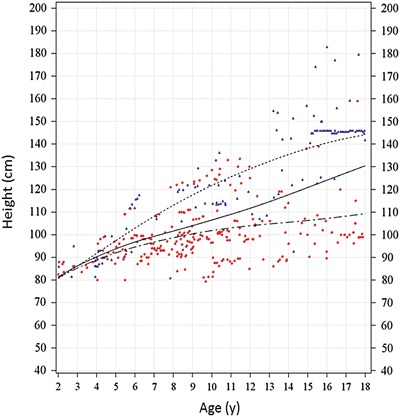
Fig. 1.

Height for age scatterplot for MPS VI patients 2–18 years of age. Height for age individual measurements for patients 2–18 years of age is plotted using color-coded symbols per pre-ERT uGAG levels (red circles for high and blue triangles for low pre-ERT uGAG levels). The LMS-generated smoothened growth curves for rapidly progressing (dotted-dash), slowly progressing (dotted), and whole population (solid line) are shown. The L, M, and S parameters for generating these smoothened curves are shown in Supplement Tables 1–3. Many patients provided multiple height measurements as shown in this figure; however, LMS method allowed for statistical assignment of equal weight per patient regardless of the number of measurements leading to robust calculations of reference growth curves. The growth curve for the slowly progressing population continued on a positive trajectory between ages 18 - 25 years likely due to distribution of patients with taller heights in this subgroup containing largely cross-sectional data (not shown). The positive slope of the growth curve for slowly progressing patients (ages 18–25 years) also skewed the overall growth curve for MPS VI (not shown). Thus, in the absence of a larger dataset (including longitudinal data) for this age range, the growth curves were truncated at age 18 years. Further, heights of MPS VI patients increase by <1 cm after age 18 years (Giugliani et al. 2014)
