
Fig. 2.
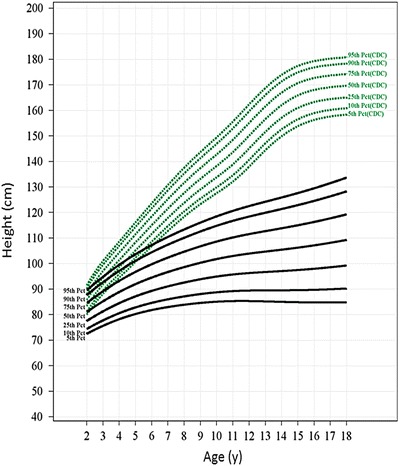
Growth charts for the rapidly progressing MPS VI population. The 5th, 10th, 25th, 50th, 75th, 90th, and 95th percentile reference growth curves for the rapidly progressing population (black) ages 2–18 years are shown along with the 5th to 95th CDC reference curves for normal population (green). CDC curves were recreated from data from the CDC website using mean heights of males and females at each age point. The L, M, and S parameters used for generating reference curves for rapidly progressing patients and the percentile values are shown in Supplement Table 2