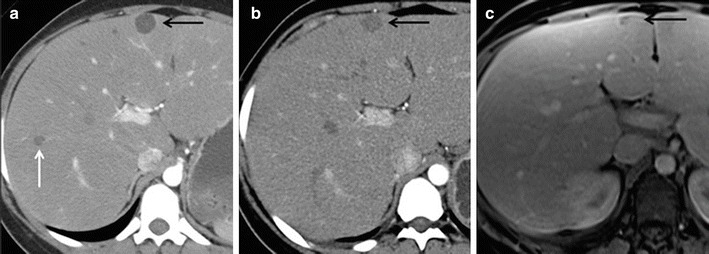
Fig. 2.

Computed tomography (CT) and MRI of a patient with GSD I with HCAs. (a) Axial CT image of the liver after administration of iodinated contrast demonstrates two hypodense lesions within the liver representing HCAs (black and white arrows). (b) Axial CT image of the liver after administration of iodinated contrast in the same patient 18 months later demonstrates decrease in size of the HCA in segment 4 of the liver (black arrow). The lesion in the right hepatic lobe, white arrow in (a), has completely resolved. (c) Axial fat-saturated T1-weighted post-contrast MR image of the liver obtained after intravenous bolus injection of gadoxetate disodium in the same patient 8 years later demonstrates continued decrease in size of the segment 4 HCA (black arrow)
