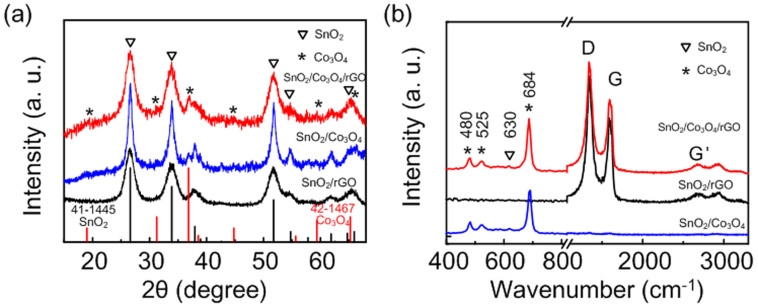
Figure 2. (a) XRD patterns and (b) Raman curves of SnO2/rGO and SnO2/Co3O4/rGO hybrid nanocomposites.
The XRD peaks of SnO2 (indicated by triangles) in all samples are indexed to the tetragonal crystal structure of SnO2 (JCPDS No. 41-1445, black line in (a)) and the Co3O4 peaks (indicated by stars) in the samples are indexed to pure face centered cubic (fcc) crystal structure of Co3O4 (JCPDS No. 42-1467, red line in (a)).

