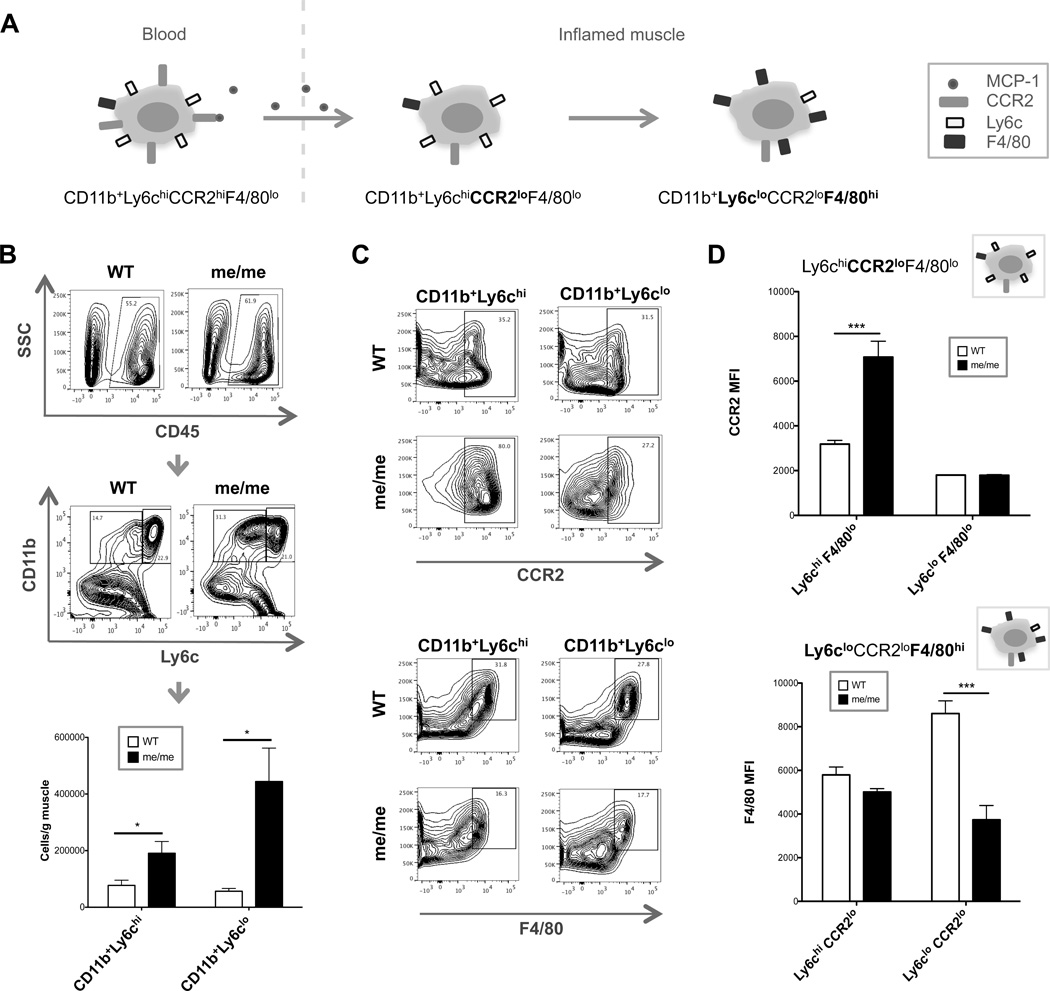
Figure 4. Quantification and phenotypic analysis of muscle-infiltrating monocytes.
(A) Cartoon schematic depicting typical maturation of blood-born inflammatory monocytes into macrophages in inflamed tissues, demonstrating downregulation of CCR2 followed by downregulation of Ly6c and upregulation of F4/80. (B–D) WT and me/me mice were sacrificed at 5 days P.I. and cells were isolated from skeletal muscle for flow cytometry analysis. (B) Representative gating strategy of WT and me/me muscle depicting initial CD45+ gate (top) to exclude myofiber debris and non-hematopoietic cells, and CD11b+Ly6chi (right) or CD11b+Ly6clo (left) monocyte gates (middle panel). Bottom graph displays absolute numbers of CD11b+Ly6chi or CD11b+Ly6clo cells per gram of skeletal muscle quantified; n=3, performed in triplicate. (C–D) F4/80 and CCR2 expression was evaluated in CD45+CD11b+Ly6clo and CD45+CD11b+Ly6chi cells. (C) Representative contour plots shown of WT (top) and me/me (bottom) mice. F4/80 gate depicts F4/80hi cells, while CCR2 gate depicts CCR2+ cells. (D) CCR2 (top) or F4/80 (bottom) MFI levels were quantified from F4/80lo or CCR2lo populations, respectively, with corresponding maturation stage cartoons as described in (A). N=3, performed in duplicate.

