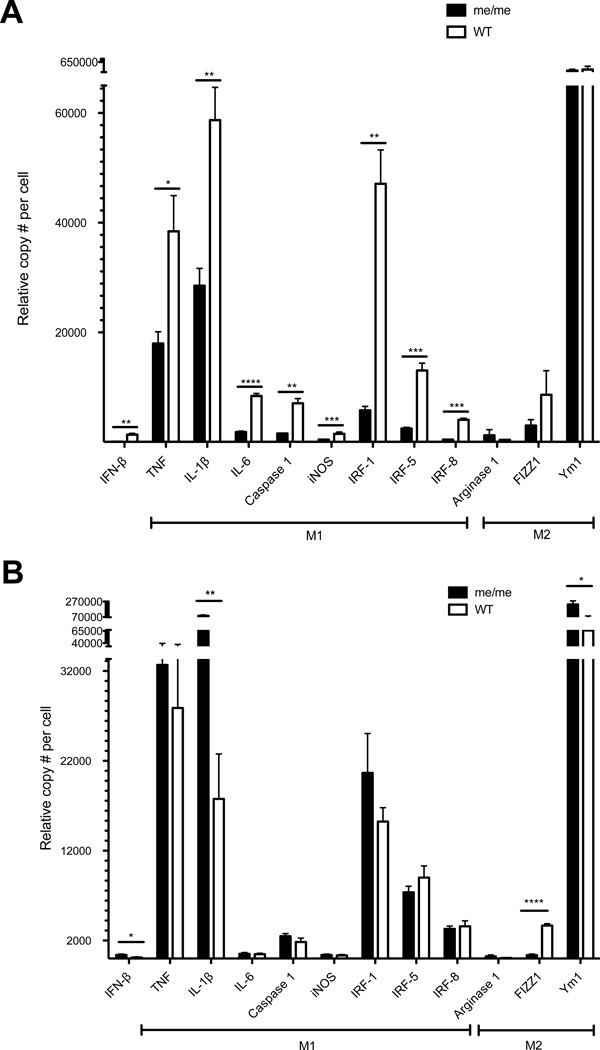
Figure 6. Gene expression in muscle or CNS-infiltrating cells.
(A) CD45+CD11b+Ly6c+ cells were sorted from skeletal muscle of WT and me/me littermates at 5 days P.I. (B) CD45+ cells were sorted from spinal cords of animals shown in (A). (A–B) RNA levels of IFN-β and M1/M2-associated genes were measured using a multiplex bead-based assay. Gene expression levels were normalized to the mean of 3 housekeeping genes (HPRT1, TBP1 and GAPDH) for each sample; n=3.

