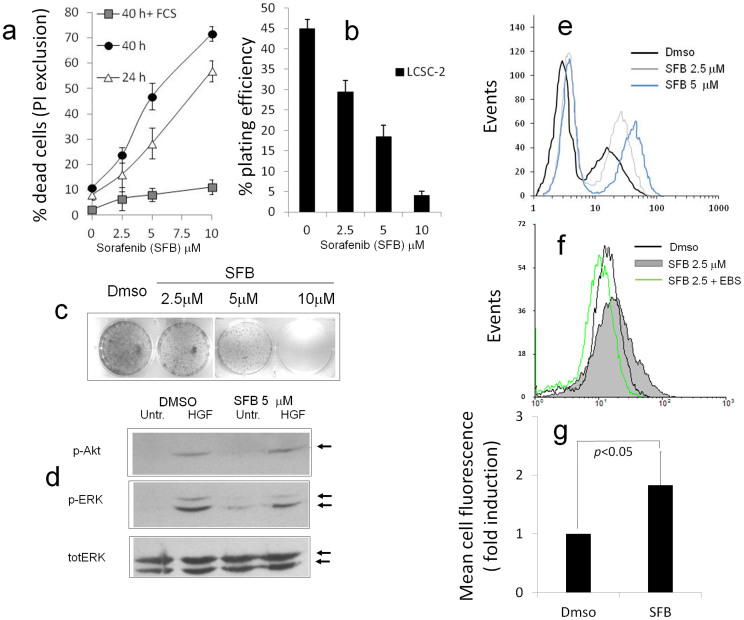
Figure 1. Growth inhibition and generation of ROS in LCSC-2 cells exposed to Sorafenib.
(a), (b) and (c) Propidium Iodide exclusion assay (a) and colony formation assay (b and c) showing dose and time-dependent growth-inhibitory effect of SFB on LCSC-2 cells. FCS = fetal calf serum. In b, bars represent plating efficiency (n° colonies/n° of plated cells); c:representative picture of colonies stained with Giemsa. In a and b bars are mean ± SD of duplicate or triplicate samples. Panels representative of several independent experiments. (d). Western Blot analysis of Akt (Ser 473) and p44-42 MAP Kinase (ERK,Thr202/Tyr204) phosphorylation after 12 hours incubation with the indicated combinations of Hepatocyte Growth factor (HGF, 50 ng/ml) and SFB. Anti total ERK immune-staining confirms equal protein loading throughout the lanes. Relevant bands are indicated by arrows. (e). Representative flow cytometry plot revealing broad distribution of H2-DCFDA fluorescence in LCSC-2 cells and increased signal (oxidation) in response to 2.5 or 5 μM SFB. (f). Effect of antioxidants and GPX mimetic Ebselen on SFB-induced ROS. A shift of cell fluorescence profile to the left confirms effective ROS scavenging by the compound. Plots representative of several independent analyses. (g). Quantitation of ROS increase in LCSC-2 cells exposed to 2.5 μM SFB for 12 hours. Values are Mean ± SD of mean fluorescence ratios (SFB/Dmso) over n = 6 independent experiments. p calculated on raw fluorescence values by paired two-tailed t-test.

